Data reduction and data distribution
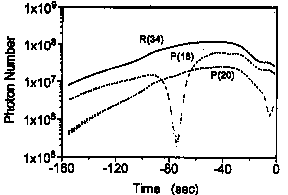
In the measurement, intensities of the transmitted laser pulses from the two lasers and intensities of the received pulses of the corresponding lasers are recorded every shot. Figure shows an example of the simulated return signals for ozone measurement. In this example, the line of one of the two CO2 lasers is switched over P(18) and P(20) lines every 1 second.

Simulated return signal(photon number per shot) for the ozone measurement
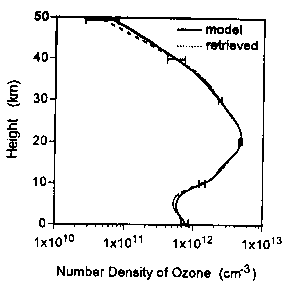
Ozone profile are retrieved from the signals using an inversion algorithm. The inversion algorithm can be applied also to obtain profile of methane. As to CFC12, HNO3, CO2, N2O, and CO, column contents are calculated.

Ozone profile retrieved from the simulated signal
RIS datas are processed by NIES, and validated datas will be published.
RIS on ADEOS
Ground system and Measurement
Return to RIS home page
Detailed information


