First Spectrum Measured with the RIS

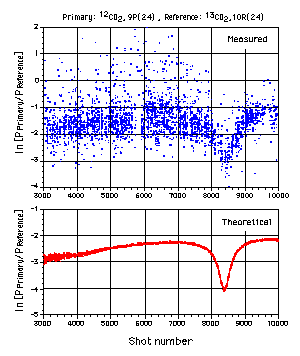
Fig. 1 The first spectrum measured with the RIS (upper), and simulated spectrum (lower) .
Upper panel of Fig. 1 shows the first spectrum measured on December 23, 1996 by using the Doppler shift of the return beam caused by the movement of the RIS. The primary and reference TEA CO2 lasers are tuned to 10R(24) of 13CO2 and 9P(24) of 12CO2, respectively. Vertical axis of Fig. 1 indicates logarithm of the ratio of signal intensity for primary laser to that for reference laser. The absorption seen in Fig. 1 is that of ozone. Error in the measured spectrum is probably caused by error in tracking the RIS and atmospheric turbulence effects. We are studying the cause of the error to improve accuracy of the measurement.
The lower panel shows a simulated spectrum generated with the HITRAN line absorption database and the US standard atmosphere. The measured spectrum is close to the simulated one, but the line width of the measured spectrum is slightly larger than the simulation. We are studying the line shape of ozone absorption using the ozone profile measured on the same day at CRL with a laser heterodyne radiometer by Tohoku University. We will also try to reduce ozone concentration from the measured spectrum. (Jan. 13, 1997)
To RIS Science Team News
Return to RIS home page
Detailed information
RIS science team members